2 Model structure
The model structure is a group of interconnected technologies through energy carriers that satisfy demands. Figure 2 illustrates the technological setup.
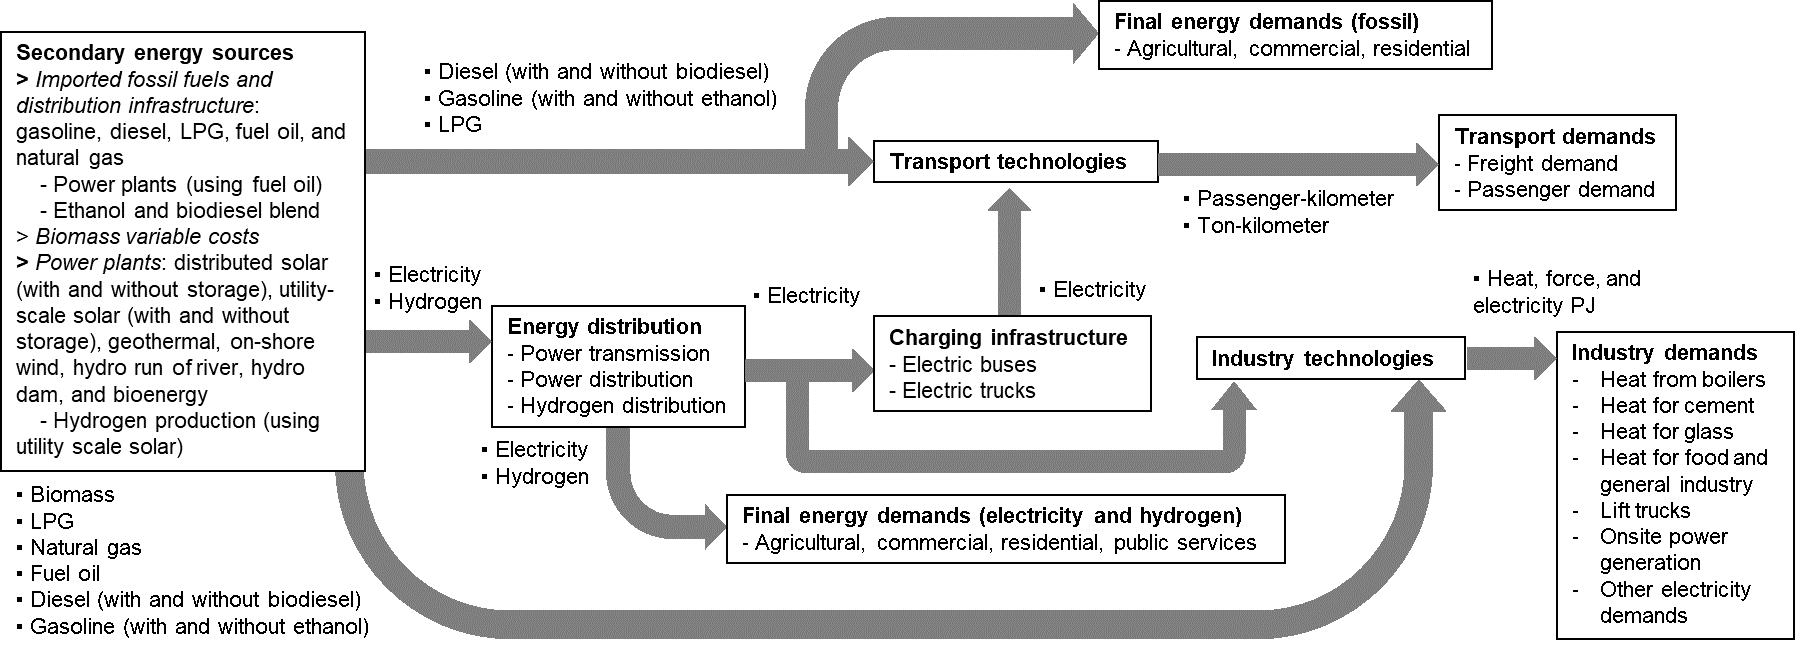
Figure 2. Energy supply chain modeled in OSeMOSYS-CR for this analysis.
The secondary energy sources are fossil fuels, electricity, and hydrogen. First, fossil fuels are all imported. Second, power plants generate electricity with renewables or burning fossil fuels. In turn, electricity is used to produce hydrogen. The secondary energy carriers are then transported for distribution. Distributed power generation feeds the demand without transmission and distribution losses.
We model transport and industry technologies in detail, which consume energy and transform it into mobility or heat, force, or electrical end-uses. The agricultural, commercial, residential, and public services consume final energy directly, having a more straightforward modeling structure.
We consider emission reductions from biofuel blends as in the first model version [1]: CO2 equivalent (CO2e) emission factors decrease proportionally to the biofuel share of the blend. Also, relative cost differences between biofuels and conventional fuels are not considered. Finally, off-road, maritime, and air transport are not modeled here.
This version’s temporal resolution is yearly and covers the period between 2018 and 2050, with only one region (i.e., Costa Rica) and one mode of operation.
2.1 Creating the model structure
For a fast model interconnection following the reference energy system (RES)
of Figure 2, we use multiple Microsoft Excel files inside the A1_Inputs folder
(see Figure 1):
A-I_Horizon Configuration.xlsx (file 1): it configures the initial and last years of the analysis period. This file is straightforward to complete.
A-I_Clasiffier_Modes_Demand.xlsx (file 2): specifies the demand sectors and their modeling approach. Table 1 shows how to specify the sectors and their approaches.
Table 1. Modeling approach per sector in sheet Sectors of file 2.
Sector code |
Sector |
Modeling approach |
|---|---|---|
AGR |
Agriculture |
Simple |
COM |
Commercial |
Simple |
IND |
Industrial |
Detailed |
PUB |
Public Sector |
Simple |
RES |
Residential |
Simple |
TRN |
Transport |
Detailed |
EXP |
Exports |
Simple |
Sectors with simple approaches demand final energy in Petajoules. Detailed sectors have more transformation stages. Figure 3 shows the fuels used in the sectors with a simple approach and lists the energy carriers demanded by the energy system. Unmarked energy carriers are used only in detailed sectors.

Figure 3. Fuels per sector with a simple modeling approach in sheet Fuel_per_Sectors of file 2.
All demand-side files (2 to 4) have the additional sheets where codes and names have an equivalence. The definition of codes is convenient to the OSeMOSYS model execution.
A-I_Modes_Transport.xlsx (file 2): contains a detailed transformation chain for transport. Figure 4 shows the transport technologies (a total of ten) that each supply each demand (a total of four). Figure 5 shows the fuel technology (or energy technology) that each technology can have. An additional sheet called Fuel_per_VehFuel links energy carriers to fuel technology, e.g., a plug-in hybrid requires gasoline and electricity.

Figure 4. Technologies per demand in sheet Mode_Broad of file 3. Technology and demand names can be codified (see interconecting technologies section to find equivalencies opening the sheets named “_to_Code”).

Figure 5. Fuels per technology in sheet Mode_per_VehFuel of file 3. Fuel and technology names can be codified (see interconecting technologies section to find equivalencies open the sheets named “_to_Code”).
A-I_Modes_Industry.xlsx (file 4): contains a detailed transformation chain for the industry sector. Figure 6 shows the industry technologies (seven) that each supply each demand (seven). Figure 7 shows the energy technology that each technology can have. Each fuel technology is associated with a unique energy carrier in the industrial sector (as in sheet Fuel_per_TecFuel).

Figure 6. Technologies per demand in sheet Mode_Broad of file 4. Technology and demand names can be codified (see interconecting technologies section to find equivalencies open the sheets named “_to_Code”).

Figure 7. Fuels per technology in sheet Mode_per_TecFuel of file 4. Fuel and technology names can be codified (see interconecting technologies section) to find equivalencies open the sheets named “_to_Code”.
A-I_Classifier_Modes_Supply.xlsx (file 5): specifies the supply chain of final energy per carrier. It has two sheets: i) PrimaryEnergy defines what technologies produce the initial fuels of the system, i.e., the energy carriers that do not require another input for their production. These include fossil fuel imports and renewable power plants. ii) SecondaryEnergy connects initial fuels with other transformation stages until they reach final delivery to consumers. These transformation stages include hydrogen production and distribution, electricity transmission and distribution, and fossil-based power generation.
In this file, the modelers define the codes of the fuels and technologies on the supply side. For initial fuels in the PrimaryEnergy sheet, modelers need to specify under the “Final in Chain” column whether a single technology-fuel relationship supplies the final demand before sector distribution (the field is True).
If more than one technology carries the fuel through the energy system, the field under the “Final in Chain” column is False. In this case, the SecondaryEnergy sheet completes all the desired technology-fuel relationships until a fuel for final consumption is defined (the “Final in Chain” field is True).
Figure 7a shows three examples of primary technologies, i.e., technologies defined in the PrimaryEnergy sheet. Gasoline imports (DIST_GSL) do not have additional transformations and produce E1GSL, which is later distributed across sectors.
The other technologies are geothermal power plants (PPGEO) and solar utility-scale without storage (PPPVTHYD), which produce electricity E1ELE and E7ELE Figure 7a. The difference between the electricity sets is their transformation.
On the one hand, E1ELE produces E3ELE transforming in the transmission and distribution supply chain Figure 7b. In the end, sectors consume E3ELE. On the other hand, E7ELE is used for green hydrogen production, which is then distributed as E3HYD for sectors to consume Figure 7c.
A comprehensive list of technologies and fuels is resulting models sets section .

Figure 8. Examples of supply-side set definition for a) primary technologies, b) electricity transmission and distribution, c) hydrogen production.
2.2 Interconnecting technologies
Here we show how to populate the Excel files to interconnect the model. After
executing A1_Mode_Structure.py, the following files appear in A1_Outputs:
A-O_AR_Model_Base_Year.xlsx (file 6)
A-O_AR_Projections.xlsx (file 7)
A-O_Demand.xlsx (file 8)
A-O_Fleet.xlsx (file 9)
A-O_Parametrization.xlsx (file 10)
The files A-O_AR_Model_Base_Year.xlsx and A-O_AR_Projections.xlsx have the function of connecting technology sets. The former defines the base year’s input and output activity ratios (AR) (see OSeMOSYS documentation [7]). The latter has an identical structure for projections.
A1_Mode_Structure.py automatically connects the model dividing
A-O_AR_Model_Base_Year.xlsx in the following sheets related in logical order:
Primary: each row contains imports, renewable power generation, and biomass technologies with their respective fuel (also called commodity) produced. The modelers must specify the value of the OutputActivityRatio, which is 1 if there is no unit conversion or efficiency.
Secondary: transforms the primary commodities into secondary or tertiary ones. Each row has a technology, an input commodity, and an output technology. Modelers must specify the InputActivityRatio and OutputActivityRatio for every chain (input fuel-technology-output fuel).
Demand Techs: has all the final energy demand commodities for sectors with a simple modeling approach. The InputActivityRatio and OutputActivityRatio values must be fixed at 1, since there is no unit convention.
Distribution Transport: disaggregates supply commodities for different transport technologies. The InputActivityRatio and OutputActivityRatio values must be fixed at 1, since there is no unit convention.
Transport: serves as the energy-transport interface. The InputActivityRatio values must reflect the fuel consumption per kilometer traveled for every transport technology type. The OutputActivityRatio value must be fixed at 1 to produce vehicle-kilometer units.
Transport Groups: converts from vehicle-kilometer units to passenger-kilometer or ton-kilometer units with the OutputActivityRatio value, reflecting the average load (passenger or ton) per trip.
Distribution Industry: disaggregates supply commodities for different industrial technologies. The InputActivityRatio and OutputActivityRatio values must be fixed at 1, since there is no unit convention.
Industry: serves as the energy-industry interface. The InputActivityRatio values must reflect the efficiency. The OutputActivityRatio value must be fixed at 1 to produce heat (steam and process heat technologies), force (lift-truck), or electricity energy units (on-site power generation and electricity demand of other equipment).
Industry Groups: converts technology output into demands. The InputActivityRatio and OutputActivityRatio values must be fixed at 1 since all energy flows are in Petajoules.
A1_Mode_Structure.py and A2_Compiler.py create pickle files that support
the pre-processing of the model.
2.3 Additional set definitions
The A2_Extra_Inputs folder (see Figure 1) has Microsoft Excel files containing elements that complement the energy system modeling:
A-Xtra_Emissions.xlsx (file 11): has two sheets to specify the emission factors of a technology. Technologies that consume or produce polluting fuels are listed in GHGs with the corresponding pollutant. Externality factors are modeled in the Externalities sheet. It lists technologies and their corresponding externality, if applicable, taking advantage of the EmissionActivityRatio parameter.
A-Xtra_Projections.xlsx (file 12): it has two sheets to parameterize transport demands. The Projections sheet has fields for years between 2019 and 2050 and contemplates five parameters exogenous to OSeMOSYS:
Variation_GDP: reflects the variation of GDP.
e_Passenger: reflects the passenger demand elasticity to GDP.
e_Freight: reflects the freight demand elasticity to GDP.
Variation_km_Passenger: reflects the change of distance traveled for passenger vehicles.
Variation_km_Freight: reflects the change of distance traveled for freight road vehicles.
The Projection_Mode sheet contains the projection modes for each variable. Crucially, these variables are used later on for other projections sheets:
User-defined: the modeler specifies the values for every year.
Interpolate to final value: the modeler specifies the base year and final year values; consecutive values after the base year can be added. The
A2_Compiler.pyinterpolates unfilled years.Flat: keeps the base year value constant.
Flat after final year: keeps the last year with entered value constant.
A-Xtra_Scenarios.xlsx (file 13): has a single sheet defining the name of the two main scenarios, region, mode of operation, and timeslice value. These tools only support one timeslice for automatic model connection.
2.4 Resulting model sets
The previous section showed how to structure the model. After executing
A1_Mode_Structure.py and A2_Compiler.py (requires completing
parameterization explained below), the A-2_Structure_Lists.xlsx file is created.
It contains all the listed technologies, sets, and emissions (besides equivalent
carbon dioxide, it also lists externality factors like health, accidents, and
congestion as in the first version [1]).
The technology and fuel sets are in Tables 2-10. Table 10 contains technologies and fuels to represent better transport sector options (e.g., non-motorized transport) and account for additional costs besides vehicles.
The modelers must copy and paste the sets from A-2_Structure_Lists.xlsx to the template in the file B1_Model_Structure.xlsx (as illustrated in Figure 1).
Table 2. Supply-side sets.
Technology |
Technology description |
Fuels |
Fuel description |
||
|---|---|---|---|---|---|
1 |
DIST_DSL |
Distribution of Diesel |
1 |
E1DSL |
Diesel |
2 |
DIST_GSL |
Distribution of Gasoline |
2 |
E1GSL |
Gasoline |
3 |
DIST_LPG |
Distribution of Liquified Petroleum Gas |
3 |
E1LPG |
Liquified Petroleum Gas |
4 |
DIST_FOI |
Distribution of Fuel Oil |
4 |
E1FO1 |
Fuel Oil |
5 |
DIST_COK |
Distribution of Petroleum Coke |
5 |
E1COK |
Petroleum Coke |
6 |
DIST_NGS |
Distribution of Natural Gas |
6 |
E1NGS |
Natural Gas |
7 |
PPHDAM |
Hydro dam power plant |
7 |
E1ELE |
Electricity from Generation |
8 |
PPHROR |
Hydro dam run of river |
8 |
E7ELE |
Electricity from Generation to Hydrogen |
9 |
PPGEO |
Geothermal power plant |
9 |
E2ELE |
Electricity from Transmission |
10 |
PPWNDON |
Wind (onshore) power plant |
10 |
E3ELE |
Electricity from Distribution |
11 |
PPPVT |
Solar photovoltaic power plant (utility-scale connected to transmission) |
11 |
E1BM |
Biomass |
12 |
PPPVTHYD |
Solar photovoltaic power plant for hydrogen production |
12 |
E2HYDG |
Produced Hydrogen |
13 |
PPPVTS |
Solar photovoltaic power plant (utility-scale connected to transmission) with storage |
13 |
E3HYD |
Hydrogen for Distribution |
14 |
PPPVD |
Distributed solar generation |
|||
15 |
PPPVDS |
Distributed solar generation with storage |
|||
16 |
DIST_BM |
Distribution of biomass |
|||
17 |
DIST_BM |
Distribution of biogas |
|||
18 |
PPBIO |
Biomass power plant |
|||
19 |
PPDSL |
Diesel power plant |
|||
20 |
PPFOI |
Fuel Oil power plant |
|||
21 |
ELE_TRANS |
Electricity Transmission |
|||
22 |
ELE_DIST |
Electricity Distribution |
|||
23 |
HYD_G_PROD |
Hydrogen Production |
|||
24 |
HYD_DIST |
Hydrogen Distribution |
Table 3. Final demand sets.
Technology |
Fuels |
Technology and Fuel descriptions |
|
|---|---|---|---|
1 |
T5DSLAGR |
E5AGRDSL |
Diesel for Agriculture |
2 |
T5ELEAGR |
E5AGRELE |
Electricity for Agriculture |
3 |
T5LPGCOM |
E5COMLPG |
Liquified Petroleum Gas for the Commercial Sector |
4 |
T5ELECOM |
E5COMELE |
Electricity for the Commercial Sector |
5 |
T5ELEPUB |
E5PUBELE |
Electricity for Public Services |
6 |
T5LPGRES |
E5RESLPG |
Liquified Petroleum Gas for the Residential Sector |
7 |
T5ELERES |
E5RESELE |
Electricity for Residential for the Residential Sector |
8 |
T5ELEEXP |
E5EXPELE |
Electricity for Exports |
Table 4. Transport energy distribution.
Technology |
Fuels |
Technology and Fuel descriptions |
|
|---|---|---|---|
1 |
T4DSL_PRI |
E4DSL_PRI |
Diesel for Private Transport |
2 |
T4GSL_PRI |
E4GSL_PRI |
Gasoline for Private Transport |
3 |
T4LPG_PRI |
E4LPG_PRI |
Liquified Petroleum Gas for Private Transport |
4 |
T4ELE_PRI |
E4ELE_PRI |
Electricity for Private Transport |
5 |
T4DSL_PUB |
E4DSL_PUB |
Diesel for Public Transport |
6 |
T4LPG_PUB |
E4LPG_PUB |
Liquified Petroleum Gas for Public Transport |
7 |
T4ELE_PUB |
E4ELE_PUB |
Electricity for Public Transport |
8 |
T4HYD_PUB |
E4HYD_PUB |
Hydrogen for Public Transport |
9 |
T4GSL_PUB |
E4GSL_PUB |
Gasoline for Public Transport |
10 |
T4ELE_HEA |
E4ELE_HEA |
Electricity for Heavy Freight Transport |
11 |
T4DSL_HEA |
E4DSL_HEA |
Diesel for Heavy Freight Transport |
12 |
T4LPG_HEA |
E4LPG_HEA |
Liquified Petroleum Gas for Heavy Freight Transport |
13 |
T4HYD_HEA |
E4HYD_HEA |
Hydrogen for Heavy Freight Transport |
14 |
T4DSL_LIG |
E4DSL_LIG |
Diesel for Light Freight Transport |
15 |
T4GSL_LIG |
E4GSL_LIG |
Gasoline for Light Freight Transport |
16 |
T4LPG_LIG |
E4LPG_LIG |
Liquified Petroleum Gas for Light Freight Transport |
17 |
T4ELE_LIG |
E4ELE_LIG |
Electricity for Light Freight Transport |
Table 5. Transport technologies.
Technology |
Technology description |
Fuels |
Fuel description |
||
|---|---|---|---|---|---|
1 |
TRSUVDSL |
Diesel SUVs |
1 |
E5TRSUV |
Vehicle-kilometers of SUV |
2 |
TRSUVGSL |
Gasoline SUVs |
2 |
E5TRSED |
Vehicle-kilometers of Sedan |
3 |
TRSUVLPG |
Liquified Petroelum Gas SUVs |
3 |
E5TRMOT |
Vehicle-kilometers of Motorcycle |
4 |
TRSUVELE |
Electric SUVs |
4 |
E5TRBUS |
Vehicle-kilometers of Bus |
5 |
TRSUVPHG |
Gasoline Plug-in Hybrid SUVs |
5 |
E5TRMBUS |
Vehicle-kilometers of Minibus |
6 |
TRSUVPHD |
Diesel Plug-in Hybrid SUVs |
6 |
E5TRTAX |
Vehicle-kilometers of Taxi |
7 |
TRSEDGSL |
Gasoline Sedan |
7 |
E5TRXTRAI |
Vehicle-kilometers of Passenger Rail |
8 |
TRSEDELE |
Electric Sedan |
8 |
E5TRXTRAIFRE |
Vehicle-kilometers of Freight Rail |
9 |
TRSEDPHG |
Gasoline Plug-in Hybrid Sedan |
9 |
E5TRYTK |
Vehicle-kilometers of Heavy Freight |
10 |
TRMOTGSL |
Gasoline Motorcycle |
10 |
E5TRYLF |
Vehicle-kilometers of Light Freight |
11 |
TRMOTELE |
Electric Motorcycle |
|||
12 |
TRBUSDSL |
Diesel Bus |
|||
13 |
TRBUSLPG |
Liquified Petroelum Gas Bus |
|||
14 |
TRBUSELE |
Electric Bus |
|||
15 |
TRBUSHYD |
Hydrogen Bus |
|||
16 |
TRBUSPHD |
Diesel Plug-in Hybrid Bus |
|||
17 |
TRMBUSDSL |
Diesel Minibus |
|||
18 |
TRMBUSLPG |
Liquified Petroleum Gas Minibus |
|||
19 |
TRMBUSELE |
Electric Minibus |
|||
20 |
TRMBUSHYD |
Hydrogen Minibus |
|||
21 |
TRMBUSPHD |
Diesel Plug-in Hybrid Minibus |
|||
22 |
TRTAXDSL |
Diesel Taxi |
|||
23 |
TRTAXGSL |
Gasoline Taxi |
|||
24 |
TRTAXELE |
Electric Taxi |
|||
25 |
TRTAXPHG |
Gasoline Plug-in Taxi |
|||
26 |
TRTAXPHD |
Diesel Plug-in Taxi |
|||
27 |
TRXTRAIDSL |
Diesel Passenger Train |
|||
28 |
TRXTRAIELE |
Electric Passenger Train |
|||
29 |
TRXTRAIFREELE |
Electric Freight Train |
|||
30 |
TRYTKDSL |
Diesel Heavy Truck |
|||
31 |
TRYTKLPG |
Liquified Petroleum Gas Heavy Truck |
|||
32 |
TRYTKELE |
Electric Heavy Truck |
|||
33 |
TRYTKHYD |
Hydrogen Heavy Truck |
|||
34 |
TRYTKPHD |
Diesel Plug-in Hybrid Truck |
|||
35 |
TRYLFDSL |
Diesel Light Truck |
|||
36 |
TRYLFGSL |
Gasoline Light Truck |
|||
37 |
TRYLFLPG |
Liquified Petroleum Gas Light Truck |
|||
38 |
TRYLFELE |
Electric Light Truck |
|||
39 |
TRYLFPHG |
Gasoline Plug-in Hybrid Light Truck |
|||
40 |
TRYLFPHD |
Diesel Plug-in Hybrid Light Truck |
Table 6. Transport groups.
Technology |
Technology description |
Fuels |
Fuel description |
||
|---|---|---|---|---|---|
1 |
Techs_SUVMIV |
SUVs (including Minivans) |
1 |
E6TDPASPRI |
Private Passenger-kilometer |
2 |
Techs_Sedan |
Sedans |
2 |
E6TDPASPUB |
Public Passenger-kilometer |
3 |
Techs_Motos |
Motorcycles |
3 |
E6TDFREHEA |
Private Passenger-kilometer Demands |
4 |
Techs_Buses |
Buses |
4 |
E6TDFRELIG |
Private Passenger-kilometer Demands |
5 |
Techs_Microbuses |
Minibuses |
|||
6 |
Techs_Taxis |
Taxis |
|||
7 |
Techs_Trains |
Trains |
|||
8 |
Techs_Trains_Freight |
Freight Trains |
|||
9 |
Techs_He_Freight |
Heavy Freight Trucks |
|||
10 |
Techs_Li_Freight |
Light Freight Trucks |
Table 7. Industry energy distribution.
Technology |
Fuels |
Technology and Fuel descriptions |
|
|---|---|---|---|
1 |
T4DSL_AL1 |
E4DSL_AL1 |
Diesel for Steam |
2 |
T4LPG_AL1 |
E4LPG_AL1 |
Liquified Petroleum Gas for Steam |
3 |
T4ELE_AL1 |
E4ELE_AL1 |
Electricity for Steam |
4 |
T4HYD_AL1 |
E4HYD_AL1 |
Hydrogen for Steam |
5 |
T4NGS_AL1 |
E4NGS_AL1 |
Natural Gas for Steam |
6 |
T4FOI_AL1 |
E4FOI_AL1 |
Fuel Oil for Steam |
7 |
T4BIO_AL1 |
E4BIO_AL1 |
Biomass for Steam |
8 |
T4ELE_CEM |
E4ELE_CEM |
Electricity for Cement |
9 |
T4HYD_CEM |
E4HYD_CEM |
Hydrogen for Cement |
10 |
T4COK_CEM |
E4COK_CEM |
Petroleum Coke for Cement |
11 |
T4BIO_CEM |
E4BIO_CEM |
Biomass for Cement |
12 |
T4LPG_GLA |
E4LPG_GLA |
Liquified Petroleum Gas for Glass |
13 |
T4ELE_GLA |
E4ELE_GLA |
Electricity for Glass |
14 |
T4HYD_GLA |
E4HYD_GLA |
Hydrogn for Glass |
15 |
T4NGS_GLA |
E4NGS_GLA |
Natural Gas for Glass |
16 |
T4FOI_GLA |
E4FOI_GLA |
Fuel Oil for Glass |
17 |
T4DSL_FBO |
E4DSL_FBO |
Deisel for Food and Beverages |
18 |
T4LPG_FBO |
E4LPG_FBO |
Electricity for Food and Beverages |
19 |
T4ELE_FBO |
E4ELE_FBO |
Liquified Petroleum Gas for Food and Beverages |
20 |
T4FOI_FBO |
E4FOI_FBO |
Fuel Oil for Food and Beverages |
21 |
T4BIO_FBO |
E4BIO_FBO |
Biomass for Food and Beverages |
22 |
T4DSL_AL2 |
E4DSL_AL2 |
Diesel for Lift Truck |
23 |
T4LPG_AL2 |
E4LPG_AL2 |
Liquified Petroleum Gas for Lift Truck |
24 |
T4ELE_AL2 |
E4ELE_AL2 |
Electricity for Lift Truck |
25 |
T4DSL_AL3 |
E4DSL_AL3 |
Diesel for On-site Power Generation |
26 |
T4LPG_AL3 |
E4LPG_AL3 |
Liquified Petroleum Gas for On-site Power Generation |
27 |
T4ELE_AL3 |
E4ELE_AL3 |
Electricity for On-site Power Generation |
28 |
T4BIO_AL3 |
E4BIO_AL3 |
Biomass for On-site Power Generation |
29 |
T4ELE_AL4 |
E4ELE_AL4 |
Electricity for Other Uses |
Table 8. Industry technologies.
Technology |
Technology description |
Fuels |
Fuel description |
||
|---|---|---|---|---|---|
1 |
INBOIDSL |
Diesel Boiler |
1 |
E5INBOI |
Heat for Steam |
2 |
INBOILPG |
Liquified Petroleum Gas Boiler |
2 |
E5INHCE |
Heat for Cement |
3 |
INBOIELE |
Electricity Boiler |
3 |
E5INHGL |
Heat for Glass |
4 |
INBOIHYD |
Hydrogen Boiler |
4 |
E5INHFO |
Heat for Food and Beverages |
5 |
INBOINGS |
Natural Gas Boiler |
5 |
E5INLTR |
Lift-Truck Force |
6 |
INBOIFOI |
Fuel Oil Boiler |
6 |
E5INOPG |
On-site Power Generation |
7 |
INBOIBIO |
Biomass Boiler |
7 |
E5INEDO |
Other Electricity Demand |
8 |
INHCEELE |
Electric Cement Kiln |
|||
9 |
INHCEHYD |
Hydrogen Cement Kiln |
|||
10 |
INHCECOK |
Petroleum Coke Cement Kiln |
|||
11 |
INHCEBO2 |
Biomass+Oxygen Cement Kiln |
|||
12 |
INHCEBIO |
Biomass Cement Kiln |
|||
13 |
INHGLLPG |
Liquified Petroleum Gas Glass Furnace |
|||
14 |
INHGLELE |
Electric Glass Furnace |
|||
15 |
INHGLHYD |
Hydrogen Glass Furnace |
|||
16 |
INHGLNGS |
Natural Gas Glass Furnace |
|||
17 |
INHGLFOI |
Fuel Oil Glass Furnace |
|||
18 |
INHFODSL |
Diesel Heat Production for Food |
|||
19 |
INHFOLPG |
Liquified Petroleum Gas Heat Production for Food |
|||
20 |
INHFOELE |
Electric Heat Production for Food |
|||
21 |
INHFOMCO |
Electric Microwave Heat Production for Food |
|||
22 |
INHFOFOI |
Fuel Oil Heat Production for Food |
|||
23 |
INHFOBIO |
Biomass Heat Production for Food |
|||
24 |
INLTRDSL |
Diesel for Lift-Truck |
|||
25 |
INLTRLPG |
Liquified Petroleum Gas for Lift-Truck |
|||
26 |
INLTRELE |
Electric Lift-Truck |
|||
27 |
INOPGDSL |
Diesel On-site Power Generation |
|||
28 |
INOPGLPG |
Liquified Petroleum Gas On-site Power Generation |
|||
29 |
INOPGELE |
Electric Battery |
|||
30 |
INOPGBIO |
Biomass On-site Power Generation |
|||
31 |
INEDOELE |
Other Electricity Demand for Industry |
Table 9. Industry groups.
Technology |
Fuels |
Technology and fuel description |
|
|---|---|---|---|
1 |
Techs_Boilers |
E7IDSTEAL1 |
Steam for all industries |
2 |
Techs_HeatCement |
E7IDHEACEM |
Process heat for cement |
3 |
Techs_HeatGlass |
E7IDHEAGLA |
Process heat for glass |
4 |
Techs_HeatFood |
E7IDHEAFBO |
Process heat for food |
5 |
Techs_LiftTruck |
E7IDLTEAL2 |
Lift truck |
6 |
Techs_OnsitePowerGen |
E7IDOPGAL3 |
On-site power generation |
7 |
Techs_ElectricityOther |
E7IDEDOAL4 |
Electricity demand for other uses |
Table 10. Special technologies and fuels.
Technology |
Technology description |
Fuels |
Fuel description |
||
|---|---|---|---|---|---|
1 |
TRANOMOTBike |
Biking infrastructure |
1 |
E6TRNOMOT |
Non-motorized demand |
2 |
TRANOMOTWalk |
Pedestrian Infrastructure |
|||
3 |
TRANPUB |
Public transport infrastructure |
|||
4 |
TRANRAILINF |
Rail infrastructure |
|||
5 |
TRANRAILCAR |
Rolling stock |
|||
6 |
TRANE6NOMOT |
Non-motorized enabling technology |
|||
7 |
TRANRAILFREINF |
Freight rail infrastructure |